Specialty coffee retail
Starbucks Business Model Canvas: How Starbucks Makes Money
Starbucks sells an affordable daily ritual, premium coffee wrapped in a consistent third-place experience, monetized through roughly 40,000 company-operated and licensed stores and a rewards app that functions like a small consumer bank.
By The BMC Templates TeamLast updated
How the model works
Starbucks does not really sell coffee. It sells a habit: a $5-7 daily ritual with the margin profile of software (beverages run 70%+ gross margin on the drink itself) delivered through roughly 40,000 stores. About 18,000 are company-operated, where Starbucks controls the experience and keeps the full margin. About 22,000 are licensed, where partners fund the real estate and Starbucks collects capital-light royalties. Layered on top is a rewards app with about 34M active US members who drive over half of US company-operated sales and pre-load $1.5-2B onto cards and balances, effectively an interest-free loan from customers. Revenue reached $37.2B in FY2025, up 3% year over year, even as the company took $1B+ in restructuring charges to reset the business under the “Back to Starbucks” turnaround.
The canvas at a glance
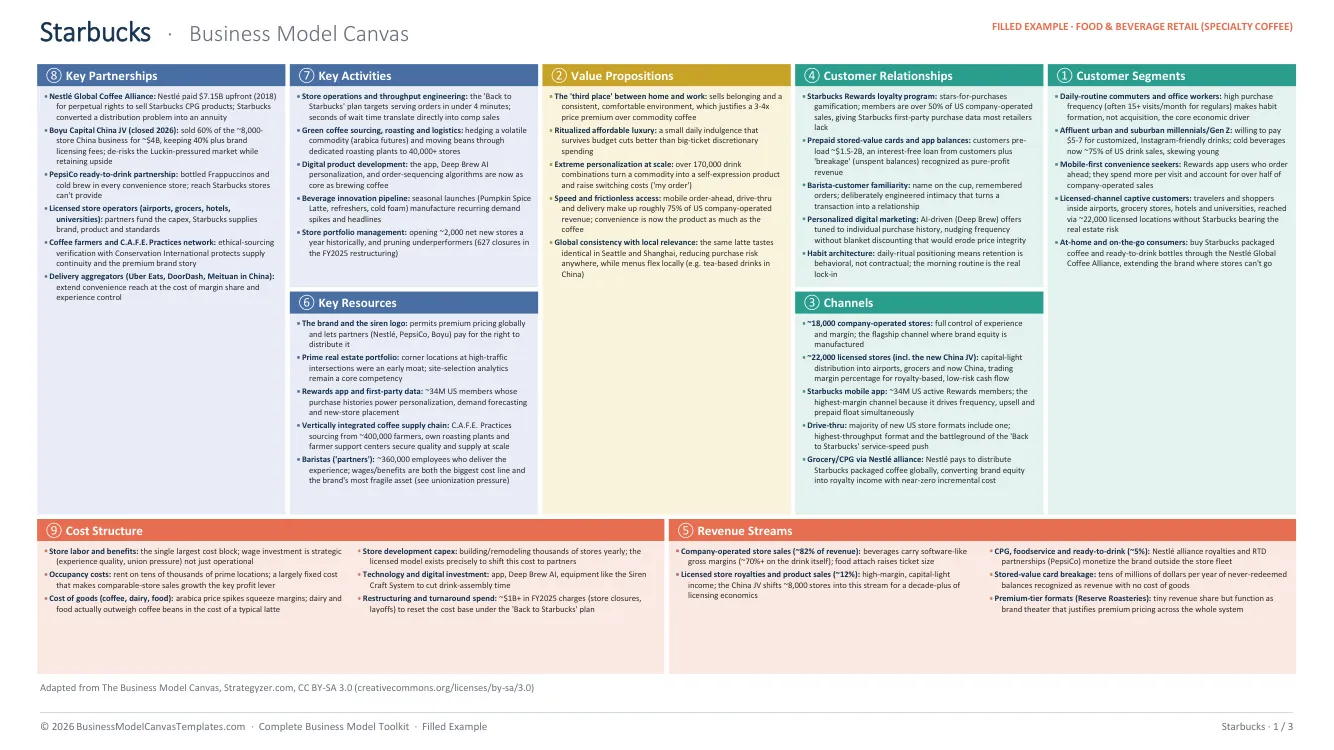
Here is Starbucks mapped across all nine blocks. If you want to build one like it, the how to fill in a business model canvas guide walks through the sequence.
Customer segments
- Daily-routine commuters and office workers: regulars often visit 15+ times a month, which makes habit formation, not acquisition, the core economic driver.
- Affluent urban and suburban millennials and Gen Z, willing to pay $5-7 for customized drinks. Cold beverages are now about 75% of US drink sales and skew young.
- Mobile-first convenience seekers: Rewards app users who order ahead spend more per visit and account for over half of company-operated sales.
- Captive customers in licensed channels (airports, grocery stores, hotels, universities) plus at-home consumers buying packaged coffee through the Nestle alliance.
Value propositions
- The “third place” between home and work: belonging and a consistent, comfortable environment that justifies a 3-4x price premium over commodity coffee.
- Ritualized affordable luxury: a small daily indulgence that survives budget cuts better than big-ticket discretionary spending.
- Extreme personalization at scale: over 170,000 drink combinations turn a commodity into a self-expression product and raise switching costs (“my order”).
- Speed and frictionless access: mobile order-ahead, drive-thru, and delivery now make up roughly 75% of US company-operated revenue. Convenience is as much the product as the coffee.
Channels
- About 18,000 company-operated stores: full control of experience and margin, the flagship channel where brand equity is manufactured.
- About 22,000 licensed stores, including the new China joint venture: capital-light distribution that trades margin percentage for royalty-based, low-risk cash flow.
- The mobile app, with about 34M active US Rewards members: the highest-margin channel because it drives frequency, upsell, and prepaid float at the same time.
- Drive-thru (included in the majority of new US store formats) and grocery shelves via Nestle, which pays to distribute Starbucks packaged coffee globally.
Customer relationships
- Starbucks Rewards: stars-for-purchases gamification that gives Starbucks first-party purchase data most retailers lack.
- Prepaid stored-value balances of roughly $1.5-2B, plus breakage (unspent balances) recognized as pure-profit revenue.
- Engineered intimacy: the name on the cup and remembered orders turn a transaction into a relationship.
- Personalized digital marketing through the Deep Brew AI system, nudging frequency without blanket discounting that would erode price integrity.
Revenue streams
- Company-operated store sales, about 82% of revenue, with 70%+ gross margin on beverages and food attach raising ticket size.
- Licensed store royalties and product sales, about 12%. The China JV shifts roughly 8,000 stores into this stream for a decade-plus of licensing economics.
- CPG, foodservice, and ready-to-drink, about 5%, through Nestle and PepsiCo partnerships.
- Stored-value card breakage: tens of millions of dollars per year recognized with no cost of goods.
Key resources
- The brand and the siren logo, which permit premium pricing globally and let partners like Nestle and PepsiCo pay for the right to distribute it.
- The Rewards app and its first-party data on about 34M US members, powering personalization, demand forecasting, and new-store placement.
- A vertically integrated supply chain: C.A.F.E. Practices sourcing from about 400,000 farmers, plus company-owned roasting plants.
- Roughly 360,000 baristas (“partners”) who deliver the experience. They are both the biggest cost line and the brand’s most fragile asset, given unionization pressure.
Key activities
- Store operations and throughput engineering: the “Back to Starbucks” plan targets serving orders in under 4 minutes, because seconds of wait time translate directly into comparable-store sales.
- Green coffee sourcing, roasting, and logistics, including hedging a volatile arabica market.
- Beverage innovation: seasonal launches like the Pumpkin Spice Latte manufacture recurring demand spikes on a schedule.
- Store portfolio management: historically about 2,000 net new stores a year, plus pruning underperformers (627 US closures in the FY2025 restructuring).
Key partnerships
- The Nestle Global Coffee Alliance: Nestle paid $7.15B upfront in 2018 for perpetual rights to sell Starbucks CPG products, converting a distribution problem into an annuity.
- The Boyu Capital China JV (closed 2026): Starbucks sold 60% of the roughly 8,000-store China business for about $4B, keeping 40% plus licensing fees.
- PepsiCo for ready-to-drink bottles, and licensed operators in airports, grocers, hotels, and universities who fund the capex.
- Coffee farmers verified through C.A.F.E. Practices with Conservation International, and delivery aggregators (Uber Eats, DoorDash, Meituan) that extend reach at the cost of margin and experience control.
Cost structure
- Store labor and benefits: the single largest cost block, and a strategic investment in experience quality, not just an operating expense.
- Occupancy costs on tens of thousands of prime locations, a largely fixed cost that makes comp-store sales growth the key profit lever.
- Cost of goods: dairy and food actually outweigh coffee beans in the cost of a typical latte, while arabica spikes squeeze margins.
- Store development capex (the licensed model exists precisely to shift this to partners) and $1B+ in FY2025 restructuring charges.
What makes this model work
The product is a habit with software margins. A customer visiting 15 times a month at 70%+ beverage gross margin is worth more than almost any retail relationship. The app, rewards stars, seasonal drinks, and drive-thru speed are all habit-reinforcement machinery. The value proposition is the ritual, not the beans.
The rewards app makes Starbucks a quasi-bank. Customers pre-load $1.5-2B, an interest-free float, and prepayment locks in the next purchase before it happens. Never-spent balances drop straight to profit as breakage. Few loyalty programs generate revenue by themselves; this one does.
Two margin engines share one brand. Company-operated stores generate high absolute dollars but carry labor and rent. Licensing (airports, Nestle CPG, the roughly $13B China JV) generates lower revenue at dramatically higher margin with zero capex. The 2025 China deal deliberately moved a risk-heavy geography onto the capital-light engine while keeping the royalties.
What you can steal
Design for frequency before you design for reach. Starbucks’ economics rest on the same customer returning daily, not on constant acquisition. Map your customer relationships block around what makes purchase two, ten, and fifty happen, then build the mechanics (streaks, balances, personalization) that make returning the default.
Get paid before you deliver. Prepaid balances fund operations, lock in future purchases, and generate breakage. Any business can borrow the principle: deposits, credits, and stored value all convert customer intent into working capital.
Watch for your channel strategy attacking your value proposition. When mobile, drive-thru, and delivery reached about 75% of US revenue, pickup crowds degraded the sit-down “third place” the premium price was built on, and Luckin out-scaled Starbucks in China on cheap, app-only convenience. The entire “Back to Starbucks” turnaround exists to resolve that conflict. Check your own canvas for blocks that quietly undermine each other; the 9 building blocks are a system, not a checklist.
A fully designed version of this Starbucks canvas, as a print-ready PDF plus an editable PowerPoint, ships with nine other real-company breakdowns inside the Complete Business Model Toolkit. To sketch your own model first, grab a free business model canvas template.
Sketch your own model first, free
The blank canvas with guiding questions, in all 5 formats: Word, PowerPoint, Excel, and both PDF sizes.
Instant delivery. No spam, unsubscribe anytime.