Streaming / subscription media
Netflix Business Model Canvas: How Netflix Makes Money
Netflix converts a fixed-cost global content library into recurring subscription and advertising revenue, using viewing data to decide what to make and scale to amortize every title across 300M+ households.
By The BMC Templates TeamLast updated
Netflix runs one of the cleanest fixed-cost, variable-revenue businesses ever built. It spends about $17 billion a year on content, a cost that stays roughly the same whether 10 million or 200 million households watch a given title, then sells access on recurring monthly subscriptions to 301 million paid households across 190+ countries. Viewing data from that base tells Netflix what to greenlight next, hits drive word-of-mouth acquisition at a marketing spend of only 6-7% of revenue, and every new subscriber lands almost entirely on the margin line. That operating leverage took operating margin from roughly 4% in 2016 to roughly 27% in 2024 on about $39 billion of revenue.
The canvas at a glance
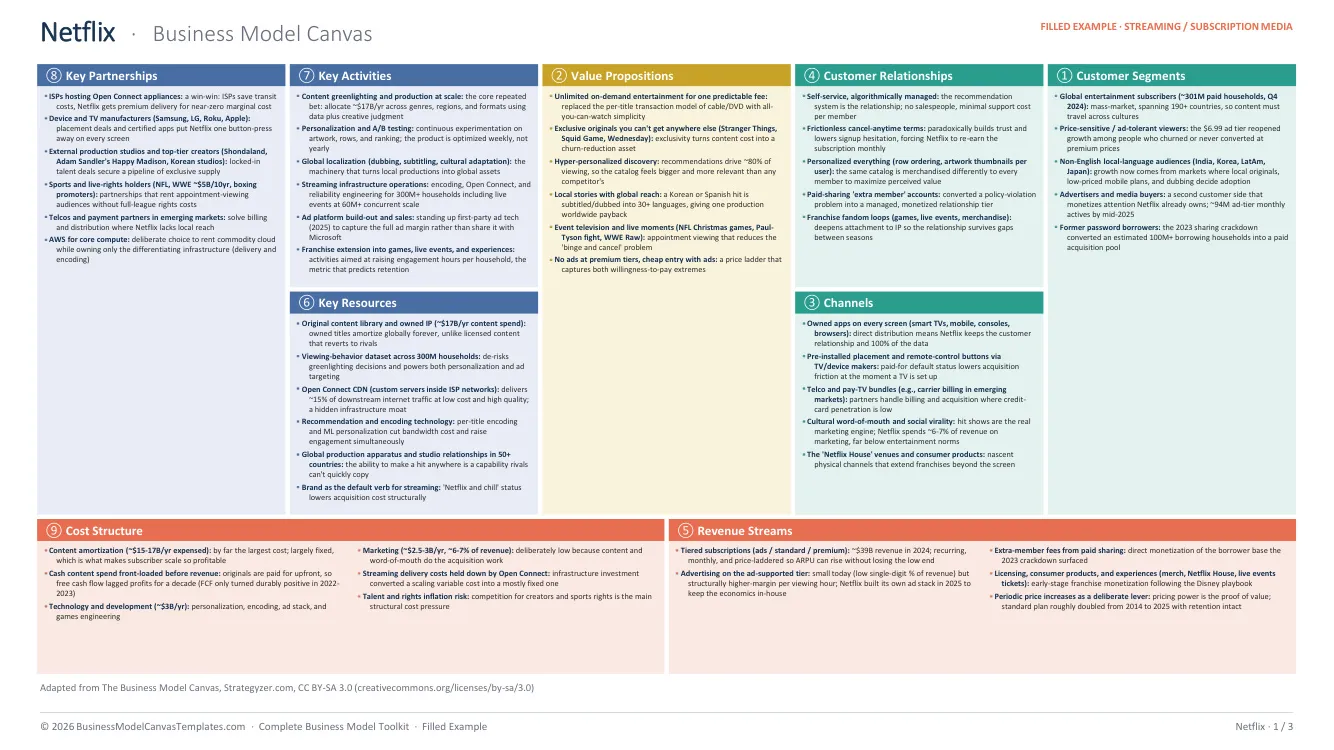
Here is the full model mapped to the nine blocks of the business model canvas.
Customer segments
- Global entertainment subscribers: about 301 million paid households at Q4 2024, spanning 190+ countries, which forces content to travel across cultures.
- Price-sensitive and ad-tolerant viewers, reopened as a growth segment by the $6.99 ad tier, plus former password borrowers: the 2023 sharing crackdown surfaced an estimated 100 million+ borrowing households as a paid acquisition pool.
- Non-English local-language audiences in India, Korea, Latin America, and Japan, where local originals, low-priced mobile plans, and dubbing decide adoption.
- Advertisers and media buyers: a second customer side monetizing attention Netflix already owns, with roughly 94 million ad-tier monthly actives by mid-2025.
Value propositions
- Unlimited on-demand entertainment for one predictable fee, replacing the per-title transactions of cable and DVD.
- Exclusive originals (Stranger Things, Squid Game, Wednesday) that turn content cost into a churn-reduction asset, plus local stories dubbed and subtitled into 30+ languages for worldwide payback.
- Hyper-personalized discovery: recommendations drive about 80% of viewing, so the catalog feels bigger and more relevant than any rival’s.
- A price ladder from a cheap ad-supported entry to ad-free premium, capturing both extremes of willingness to pay, with event television (NFL Christmas games, the Paul-Tyson fight, WWE Raw) countering the binge-and-cancel pattern.
Channels
- Owned apps on every screen: smart TVs, mobile, consoles, and browsers, so Netflix keeps the customer relationship and 100% of the data.
- Paid placement with TV and device makers, including dedicated remote-control buttons, cutting acquisition friction at the moment a TV is set up.
- Telco and pay-TV bundles with carrier billing in emerging markets where credit-card penetration is low.
- Cultural word of mouth as the real marketing engine: Netflix spends only 6-7% of revenue on marketing, far below entertainment norms.
Customer relationships
- Self-service and algorithmically managed: the recommendation system is the relationship, with no salespeople and minimal support cost per member.
- Cancel-anytime terms that build trust, lower signup hesitation, and force Netflix to re-earn the subscription monthly.
- Personalized everything, down to row ordering and per-user artwork thumbnails, so the same catalog is merchandised differently to each member.
- Paid-sharing “extra member” accounts, which turned a policy violation into a monetized relationship tier, plus franchise fandom loops through games, live events, and merchandise.
Revenue streams
- Tiered subscriptions (ads, standard, premium): about $39 billion of revenue in 2024, recurring and price-laddered so average revenue per user can rise without losing the low end.
- Advertising on the ad tier: low single digits as a share of revenue today, but structurally higher-margin per viewing hour, and Netflix built its own ad stack in 2025 to keep those economics.
- Extra-member fees from paid sharing, monetizing the borrower base directly.
- Licensing, consumer products, and experiences, plus periodic price increases as a deliberate lever: the standard plan roughly doubled from 2014 to 2025 with retention intact.
Key resources
- The original content library and owned IP, funded by roughly $17 billion a year in content spend; owned titles amortize globally forever instead of reverting to rivals.
- The viewing-behavior dataset across 300 million households, which de-risks greenlighting and powers both personalization and ad targeting.
- Open Connect, a custom CDN with servers inside ISP networks that delivers about 15% of downstream internet traffic at low cost. A hidden infrastructure moat.
- A global production apparatus in 50+ countries and a brand so dominant it became the verb for streaming.
Key activities
- Content greenlighting and production at scale: the core repeated bet, allocating about $17 billion a year across genres, regions, and formats using data plus creative judgment.
- Continuous personalization and A/B testing on artwork, rows, and ranking; the product is optimized weekly, not yearly.
- Global localization (dubbing, subtitling, cultural adaptation) and streaming operations at extreme scale, including live events at 60 million+ concurrent streams.
- Building out first-party ad tech and sales, and extending franchises into games, live events, and experiences to raise engagement hours, the metric that predicts retention.
Key partnerships
- ISPs that host Open Connect appliances: they save transit costs while Netflix gets premium delivery at near-zero marginal cost.
- Device and TV manufacturers (Samsung, LG, Roku, Apple) whose placement deals put Netflix one button-press from every screen.
- External studios and locked-in creators (Shondaland, Happy Madison, Korean studios), plus sports and live-rights holders such as the NFL and WWE (about $5 billion over 10 years).
- AWS for core compute: Netflix rents commodity cloud and owns only the differentiating infrastructure.
Cost structure
- Content amortization of $15-17 billion a year, by far the largest cost and largely fixed, which is exactly what makes subscriber scale so profitable.
- Front-loaded cash content spend: originals are paid for upfront, so free cash flow lagged profits for a decade and turned durably positive only in 2022-2023 (about $6.9 billion in 2024).
- Technology and development around $3 billion a year; marketing held at $2.5-3 billion, or 6-7% of revenue.
- The main structural pressure: talent and sports-rights inflation as competitors bid for the same creators.
What makes this model work
Operating leverage is the whole story. A hit costs the same whether 10 million or 200 million households watch it. Once the subscriber base crossed the point where fixed content costs were covered, nearly every incremental dollar of subscription revenue fell to operating profit. That is the mechanism behind margins going from about 4% to about 27% in eight years, and it is worth mapping in your own cost structure block: which of your costs are truly fixed?
The flywheel compounds because of the data layer. More subscribers fund a bigger content budget, which produces more hits, which attract more subscribers. What keeps rivals from copying it is that Netflix’s viewing dataset makes each greenlight bet smarter, and no competitor matches both its 300 million household scale and its data depth at the same time.
When growth stalled, Netflix switched levers instead of panicking. After the first-ever subscriber loss in 2022, the company re-accelerated revenue without needing new users: paid sharing monetized 100 million+ borrowing households, the ad tier captured low-willingness-to-pay viewers at $7 while premium payers stayed at $25, and price rises kept working. By Q4 2024 Netflix stopped reporting subscriber counts entirely, a public signal that monetization, not headcount, is now the scoreboard.
What you can steal
Own the moat, rent the commodity. Netflix owns content, recommendations, and Open Connect delivery, and rents AWS compute, external studios, and telco billing. Before you build anything, sort your key resources into differentiating and commodity, then spend capital only on the first pile.
Design a price ladder, not a price. The $6.99-to-$25 tier structure captures both ends of willingness to pay, and the cheap tier monetizes its users a second way through ads. Almost any subscription business can add a low-priced entry tier that pays for itself through a different revenue stream.
Let the product do the marketing. Netflix spends 6-7% of revenue on marketing because hit shows and word of mouth do the acquisition work. If your customer acquisition cost is high, the fix may live in the product’s shareability, not in the ad budget. Sketching your own model against these blocks takes about an hour with a free business model canvas template, and the how-to guide walks through the block order that works best.
A fully designed version of this Netflix canvas, as a print-ready PDF plus an editable PowerPoint, ships with nine other real-company breakdowns inside the Complete Business Model Toolkit.
Sketch your own model first, free
The blank canvas with guiding questions, in all 5 formats: Word, PowerPoint, Excel, and both PDF sizes.
Instant delivery. No spam, unsubscribe anytime.